EU Commercial Vehicle Registrations in 2025: A Planning Note for Fleet Telematics Buyers
A dated comparison of vans, trucks and buses, with the source counts and practical limits for procurement planning.
LEXUNYU · Published 14 October 2026
On this page
Source release: 29 January 2026 · Historical comparison: EU new registrations, full-year 2025 versus full-year 2024
In 2025, new van and truck registrations in the EU fell year over year, while bus registrations rose. The changes were not uniform across categories: vans (up to 3.5 tonnes) were down 8.8%, trucks (over 3.5 tonnes) were down 6.2%, and buses (over 3.5 tonnes) were up 7.5%. These figures describe the flow of newly registered vehicles during two calendar years. They are useful background when fleet teams discuss vehicle mix and deployment timing, but they do not measure the size of the vehicle fleet, telematics adoption, tracker purchases, or demand for GPS hardware.
For a buyer, the practical use is limited and specific: take the figures as a prompt to check whether a planned deployment still matches the vehicles and project windows in your own asset list. The registration totals cannot make that decision for you.
What changed in the EU
The table uses the 2025 ACEA release’s own full-year 2024 comparators. Absolute changes below are arithmetic differences between the two registration counts; the percentage column reports the year-over-year figures shown in the release, rounded to one decimal place.
| Vehicle category | Definition in the release | 2025 new registrations | 2024 new registrations, same release | Absolute change | Year-over-year change |
|---|---|---|---|---|---|
| Vans | Up to 3.5 tonnes | 1,447,273 | 1,586,761 | −139,488 | −8.8% |
| Trucks | Over 3.5 tonnes | 307,460 | 327,775 | −20,315 | −6.2% |
| Buses | Over 3.5 tonnes | 38,238 | 35,583 | +2,655 | +7.5% |
The percentages are calculated as (2025 registrations − 2024 registrations) / 2024 registrations × 100, then displayed to one decimal place. For example, the van count declined by 139,488 registrations against a 2024 base of 1,586,761, which rounds to −8.8%. A percentage expresses a change relative to its own base. It does not show which category had the greatest absolute change, and neither measure is a category’s share of the commercial-vehicle market.
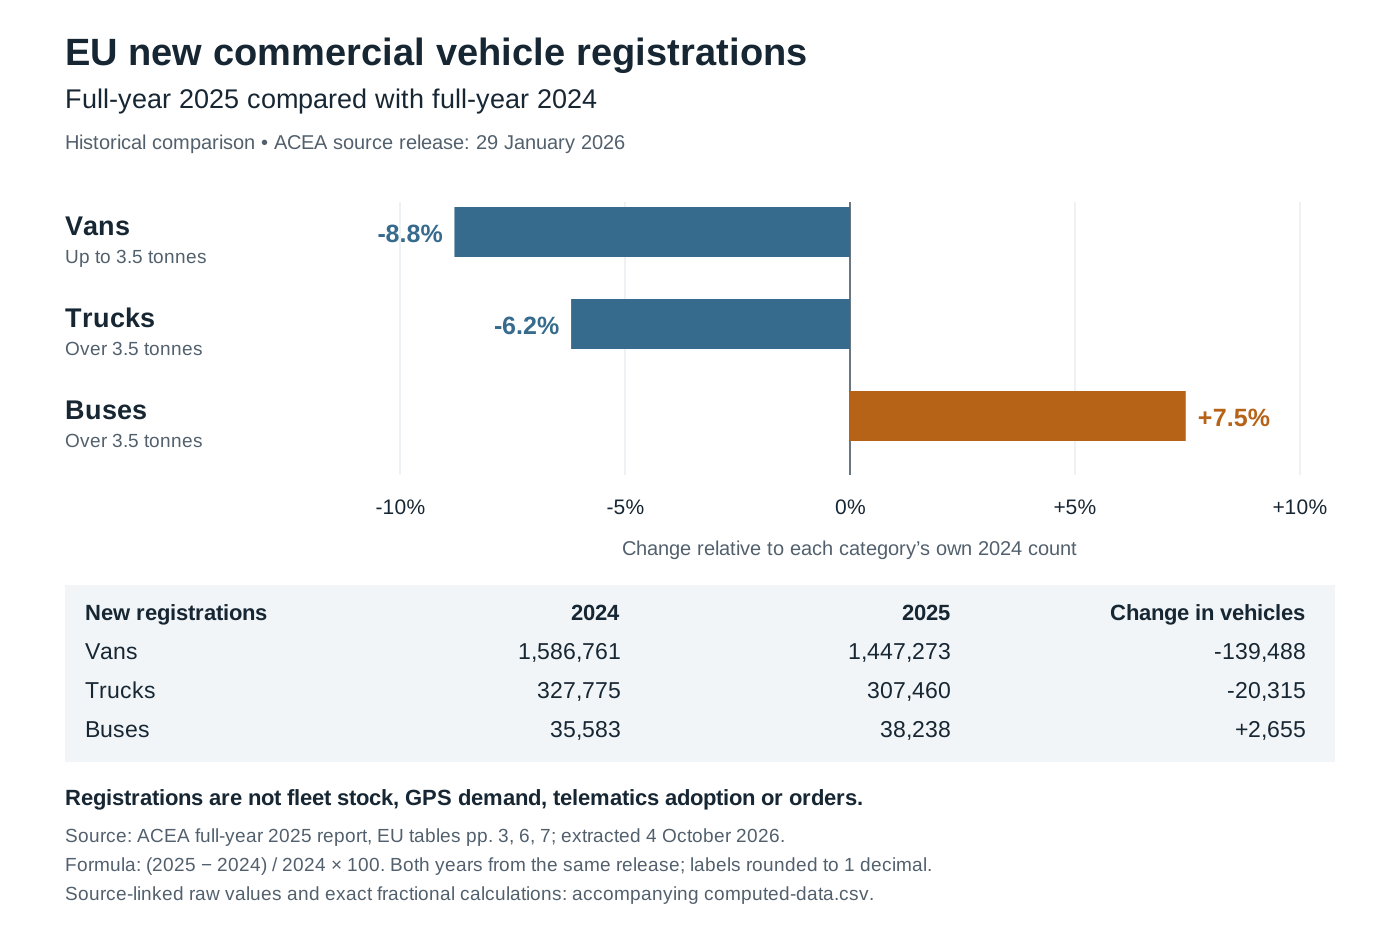
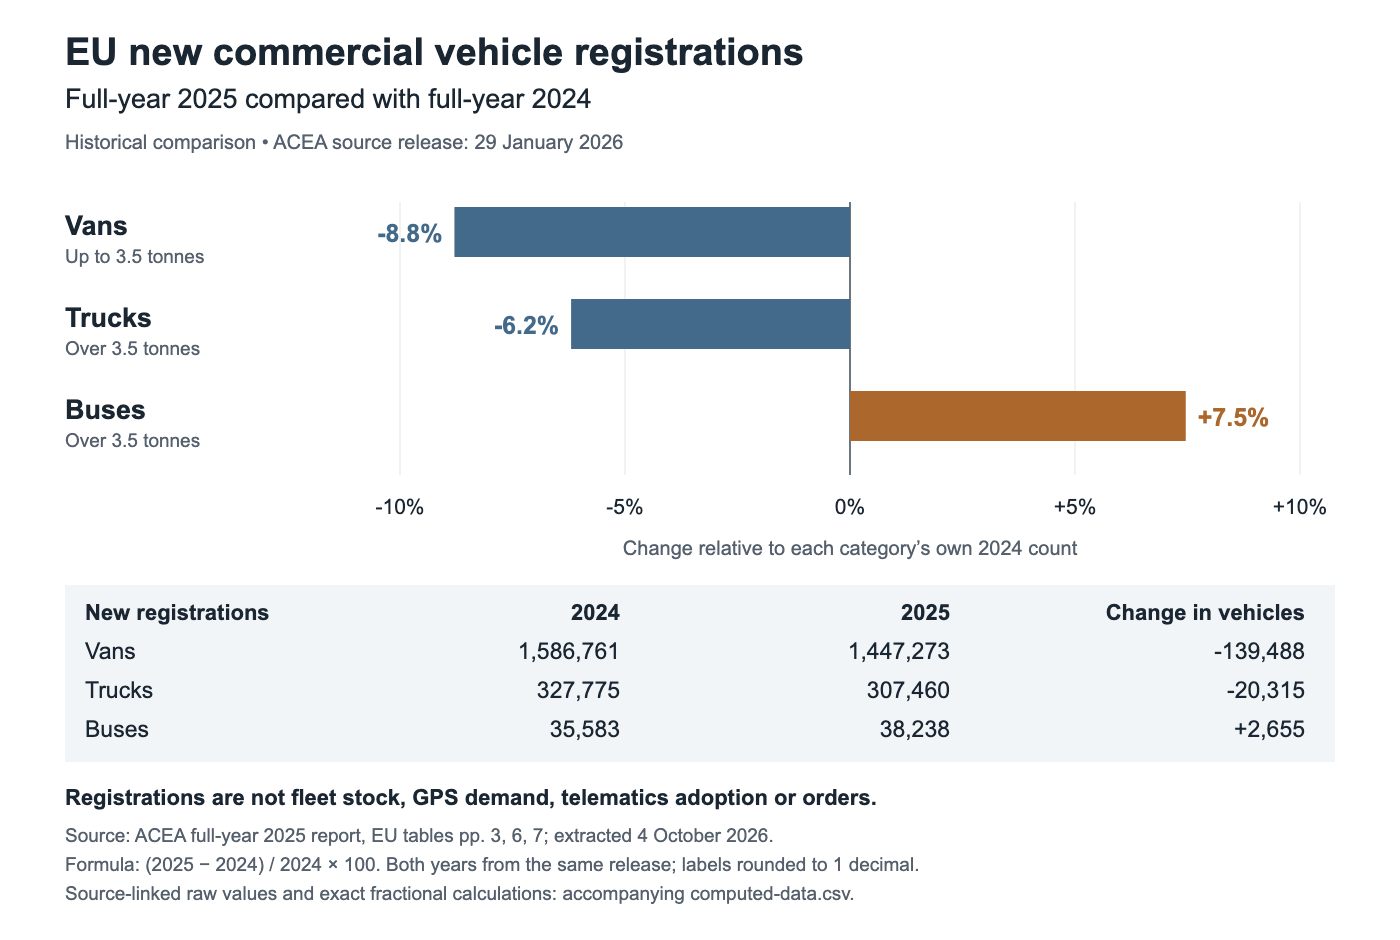
Each bar compares a category’s 2025 registrations with that same category’s 2024 base; it does not compare category market shares. The source counts and calculation are available in the computed data CSV.
How to use the comparison in a planning discussion
These totals can help frame a question, not answer a procurement decision. If a fleet project is being planned around a particular vehicle category, a change in new registrations is a reasonable reason to revisit the project’s assumptions: does the buyer’s current asset list still reflect the vehicles expected to enter service, and is the installation window still realistic? That is an editorial planning implication, not a recommendation made by ACEA and not a forecast of device demand.
Start with the buyer’s own records. Identify the vehicles or assets actually in scope, their category, operating locations, expected arrival or installation window, and the number of units in each project batch. Keep the project list distinct from national or EU registration totals. An organization may buy used vehicles, move vehicles between depots, extend the life of existing assets, or deploy equipment across a mixed fleet. None of those decisions can be read from new-registration counts alone.
Then confirm the installation and data requirements for the actual vehicles. A planning conversation may need to cover power and mounting, vehicle access, installation responsibility, the project’s reporting needs, the receiving platform or data path, and the specific hardware configuration under consideration. These are project inputs to verify with the buyer and relevant suppliers or integrators. The registration data does not establish that a particular tracker or gateway fits a vehicle, works with a platform, or meets a market’s requirements.
Finally, decide whether to split or sequence deployment using operational evidence: confirmed vehicle availability, site readiness, installation capacity, project acceptance criteria, and the buyer’s own timing. If the registration figures prompt a change in the buyer’s forecast, record that as a planning assumption and validate it against the buyer’s asset schedule. Do not convert the reported percentages into a device quantity, a replacement rate, or a purchasing target.
| Buyer planning question | Evidence to use for the project decision | What the ACEA figures contribute |
|---|---|---|
| Which assets are actually in scope? | The buyer’s current asset list and confirmed vehicle categories | A dated, EU-level context for new registrations by category |
| When can installation begin? | Delivery or availability dates, depot access, installer capacity, and agreed project windows | A reason to revisit assumptions; no schedule or delivery forecast |
| Which equipment configuration is suitable? | Vehicle-level installation details and exact hardware, firmware, and platform evidence | No compatibility or suitability evidence |
| How many units should be ordered? | Approved project quantities, pilot results, and the buyer’s purchasing plan | No hardware-demand estimate or order quantity |
For teams reviewing a project, existing materials can help organize those checks: the field and reporting interval sheet captures project inputs; hardware and platform compatibility explains the need to check the receiving path; and GPS tracker sample validation covers model-specific sample and configuration checks. They support project verification; they do not turn market registration statistics into a forecast.
What new registrations cannot tell you
New registrations are not the same as the total number of vehicles in operation. The annual count does not include the full stock of vehicles already in use, and by itself it does not tell a reader how many vehicles were retired, replaced, exported, transferred, or kept in service. This article applies no assumed retirement or substitution rate to the reported totals.
The figures also do not measure how many vehicles have telematics, what equipment they use, whether a fleet intends to buy connected hardware, or what it has budgeted. A decline in registrations in a vehicle category must not be described as a decline in GPS or telematics demand. A rise in bus registrations likewise does not prove increased demand for bus tracking systems. Those conclusions would require different evidence, such as buyer-level plans or a suitable, directly measured telematics dataset; neither is analyzed here.
The comparison covers the European Union, not every country commonly described as part of Europe. It reports vans, trucks, and buses under the stated weight thresholds and does not analyze country-level results, powertrain mix, vehicle use, or differences among fleets. It compares full-year 2025 with the 2024 comparator included in the same ACEA release, published on 29 January 2026. The release’s reported values may be subject to later revision; the six annual counts used here were rechecked against the linked report on 14 October 2026; other revision notices were not exhaustively searched. Seasonal-adjustment or coverage-revision details are not established by the retained source excerpt, so no claim about their presence or absence is made.
These are historical full-year results, not a current 2026 market assessment. They provide no evidence about 2026 full-year registrations or the direction of current demand. The fact that a source was published in January 2026 does not make its 2025 results a forecast for the following year.
Frequently asked questions
Does a fall in van or truck registrations mean fleets will buy fewer GPS trackers?
No such conclusion follows from these data. The figures count newly registered vehicles; they do not measure tracker installations, telematics adoption, hardware orders, or purchasing intent. Use a buyer’s project and asset evidence to estimate equipment needs.
Why use the 2024 figures from the same ACEA release?
The same-release comparator keeps this calculation tied to one published comparison set. The article uses the 2024 values reported alongside the 2025 results rather than substituting values from a different release. The values and formula are shown so the arithmetic can be checked.
Does the increase in bus registrations prove that connected-bus projects are growing?
No. The bus figure shows that new bus registrations in the defined EU category rose between these two years. It does not describe connected-bus projects, installed systems, procurement plans, or market revenue.
Can I use these totals to estimate my fleet’s replacement cycle?
No. The table contains registration counts, not fleet age, scrappage, retirement, or replacement data. Build a replacement view from your own asset register and verified lifecycle information.
Are these results a view of the 2026 market?
They are full-year 2025 results compared with full-year 2024, from a release dated 29 January 2026. This article does not assess 2026 registrations or current telematics demand.
Source and method
ACEA, “New commercial vehicle registrations: vans −8.8%, trucks −6.2%, buses +7.5% in 2025,” published 29 January 2026, full-year 2025 commercial vehicle registrations report (PDF). The source reports data compiled from national associations, ACEA members, and S&P Global Mobility. The figures used here are EU new registrations for full-year 2025 and full-year 2024: vans up to 3.5 tonnes (page 3), trucks over 3.5 tonnes (page 6), and buses over 3.5 tonnes (page 7). The source was extracted on 4 October 2026. No unpublished 2026 full-year data are included.
The percentage calculation is (current period − base period) / base period × 100; displayed values are rounded to one decimal place. Absolute differences are simple subtraction of the two published counts. Reported values and derived arithmetic are distinct: ACEA supplies the registration counts and stated category changes, while the absolute differences and planning discussion are calculations and editorial interpretation. The six annual counts were rechecked against the linked report on 14 October 2026; this is not an exhaustive search of other revision notices.
If you are planning a fleet telematics project, you can contact LEXUNYU to discuss your vehicle categories, locations, deployment window, and the hardware or integration evidence that still needs checking.